
 End-to-end outreach workflow




Table of Contents
- BLS counts 39,250 in 2025 (not including freelancers)
- Census counted roughly 87,000 working journalists in 2024 which includes freelancers.
- BLS counts fell from 64,590 in 1999 to 39,250 in 2025.
- Census journalism employment increased between 2018 and 2021, then remained essentially flat through 2024.
- BLS found 7.2 payrolled PR professionals per every payrolled journalist.
- Census ratio found approximately 1.8 PR professionals per journalist; the 2025
- Overall PR employment expanded while payroll journalists has shrunk.
I came across a Bloomberg column by Justin Fox that blew my mind.
It was a chart based on US Bureau of Labor Statistics data showing journalists dropping off a cliff while PR professionals climbed:
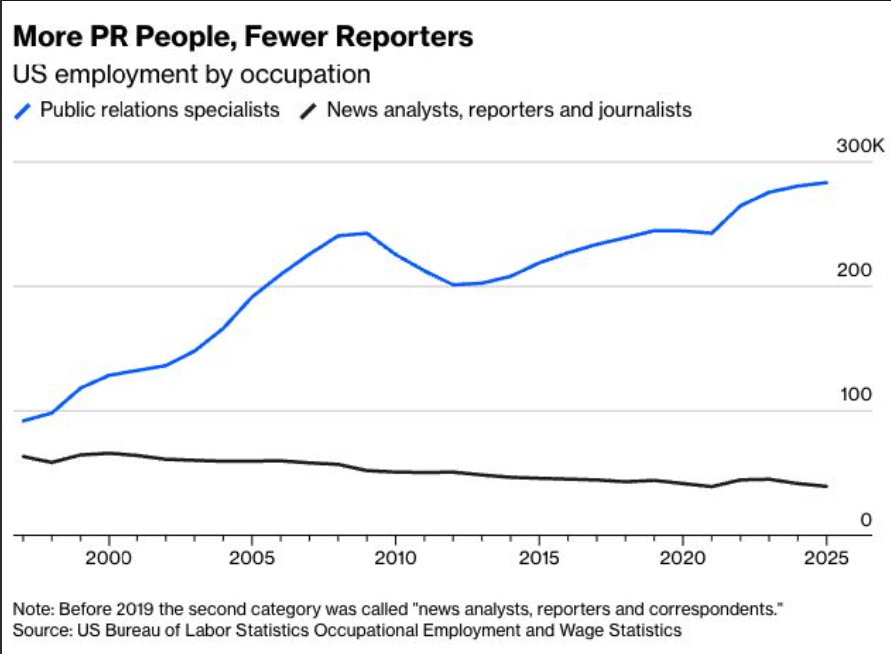
I posted it on LinkedIn and got some nice hurrahs from the PR industry, because it confirms why things have felt harder.
Then I went and pulled the underlying data myself, expecting to write up a tidy version of the same story.
That’s not what happened.
It turns out “how many journalists are there” doesn’t have one answer.
So this post is me trying to work out how many journalists there are in the US, how many PR professionals, and what it all means for you.
Note: I recently posted a UK journalist jobs study as well.
The Data Sources I Used (and Why It Matters)
Before we get to the takeaways, I need to briefly explain the two official datasets for this study because they drastically impact the takeaways:
BLS Occupational Employment and Wage Statistics (BLS OEWS) for U.S. payroll jobs from 1999 through 2025.
US Census American Community Survey (ACS) for employed U.S. residents, including self-employed workers, from 2018 through 2024.
The first, BLS, only shows payroll jobs. If you’re freelance, self-employed, or write your own newsletter, BLS doesn’t count you.
ACS estimates employed people based on their primary job, including freelancers.
But someone holding two payroll jobs could appear twice in establishment employment but only once in the ACS.
One more thing before the numbers.
Neither dataset has a category called “journalists.”
Both use the same one:
| Category | BLS occupation code and title | Census occupation code and title |
|---|---|---|
| Journalism jobs | 27-3023, News Analysts, Reporters, and Journalists | 2810, News analysts, reporters, and journalists |
| PR jobs | 27-3031, Public Relations Specialists | 2825, Public relations specialists |
Census occupation codes are built on the same SOC framework BLS uses, so these are the same defined occupations.
Both also keep broadcast announcers and radio DJs in a separate code, so neither number is inflated by that group. (Not that anyone listens to the radio anymore…)
I’ll use “journalism jobs” and “PR jobs” as shorthand from here.
How Many Journalists Are There in the US?
The most recent number of journalism jobs, as per the US BLS, is 39,250 in 2025.
That means payroll journalism jobs fell from 64,590 in 1999 to 39,250 in 2025, a 39.23% decline.
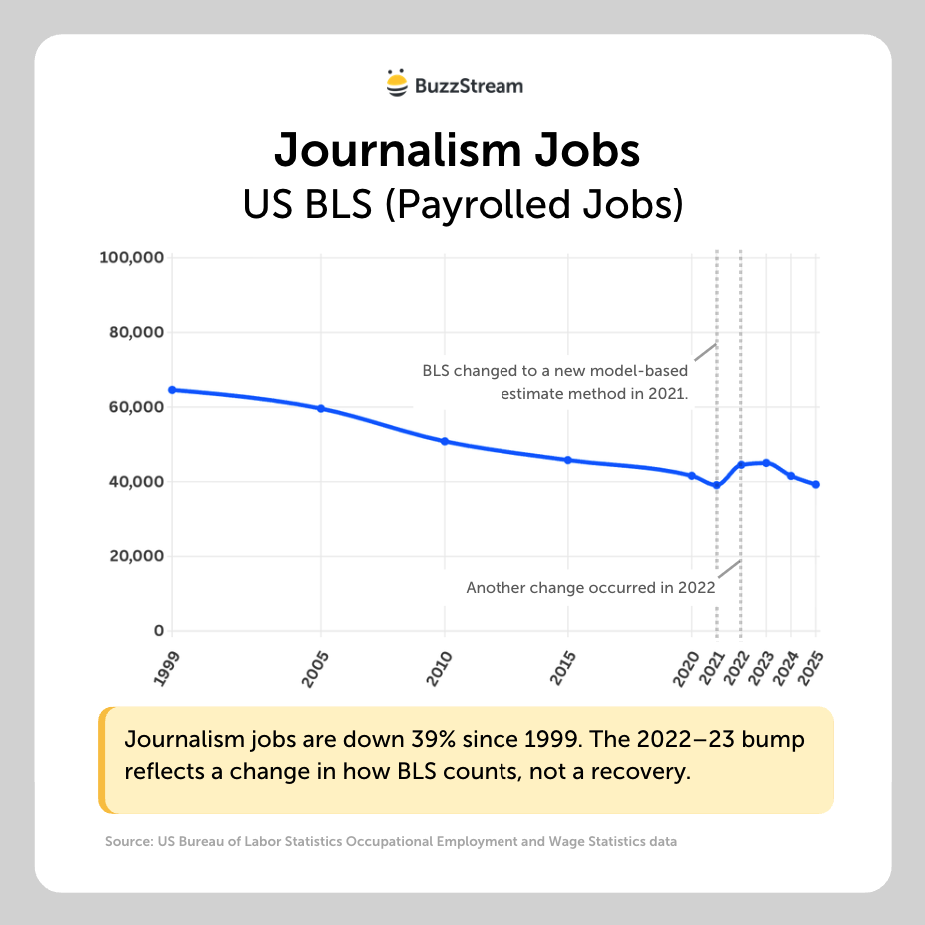
Here it is in table format:
| Era | Year | BLS payroll journalism jobs |
|---|---|---|
| Old method | 1999 | 64,590 |
| Old method | 2005 | 59,600 |
| Old method | 2010 | 50,800 |
| Old method | 2015 | 45,780 |
| Old method | 2020 | 41,580 |
| New method | 2021 | 39,080 |
| New method | 2022 | 44,530 |
| New method | 2023 | 45,020 |
| New method | 2024 | 41,550 |
| New method | 2025 | 39,250 |
But here’s the first of many weird, confusing things with the data.
BLS changed how it calculates OEWS estimates starting with the May 2021 data, moving to a model-based approach.
BLS also moved to a new industry classification system (NAICS) starting with the May 2022 estimates.
You can kind of see how both disrupt the data: jobs dropped to 39,080 in 2021 (the estimation-method year), then rose to 44,530 in 2022 and 45,020 in 2023 (the NAICS years).
In fact, in 2025, we’re seeing the data flatten out.
However, this data has a much bigger problem: it doesn’t include freelancers because they aren’t on payroll.
So, let’s look at the Census, which does include freelancers.
How Many Journalists Are There According to the US Census?
The Census Bureau counted 87,160 journalists in 2024, their most recent number.
Compared with 73,329 in 2018, that’s a 19% increase.
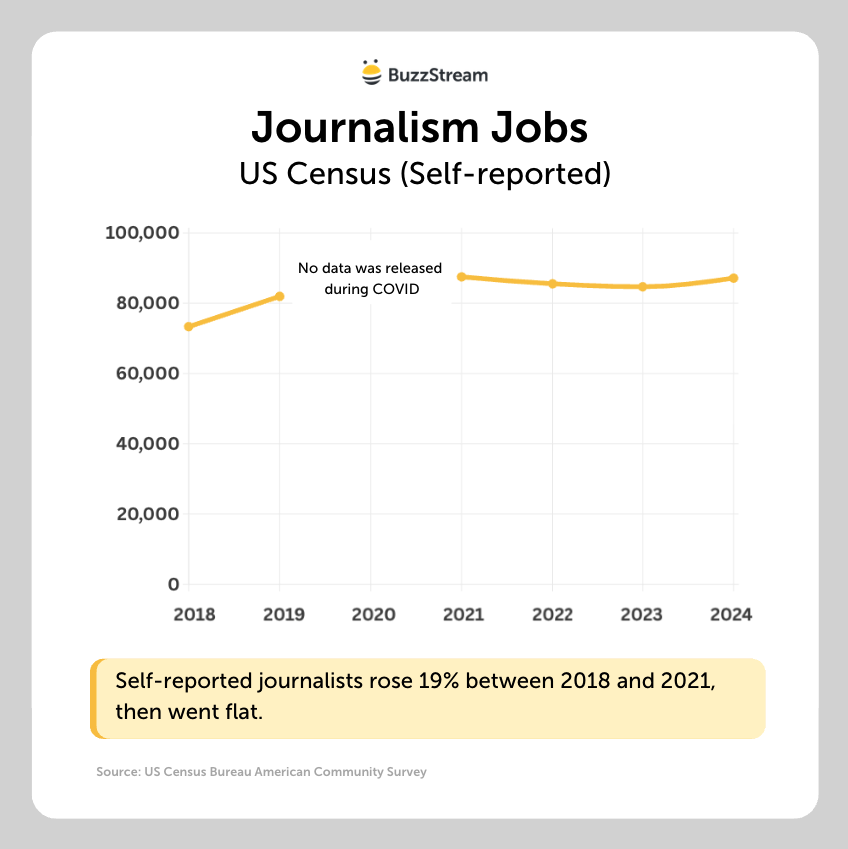
Here it is in table format:
| Year | Census journalists | Margin of error |
|---|---|---|
| 2018 | 73,329 | ±4,195 |
| 2019 | 81,961 | ±5,537 |
| 2021 | 87,515 | ±5,836 |
| 2022 | 85,539 | ±5,248 |
| 2023 | 84,693 | ±5,570 |
| 2024 | 87,160 | ±6,279 |
(And for clarity here, Census only shows this data back to 2018 because that’s the first year it used the current occupation code numbers I’m citing throughout this piece: 2810 for journalists, 2825 for PR).
OK, so why is this showing an increase?
First, I checked the margin of error to just be sure it wasn’t noise.
(Worth noting the margin itself grew from ±4,195 in 2018 to ±6,279 in 2024.
The Census getting less precise is its own small story about survey response rates. But we’ll ignore that for now.)
All of the growth happened between 2018 and 2021.
Since then, it’s been flat. 87,515 in 2021, 87,160 in 2024.
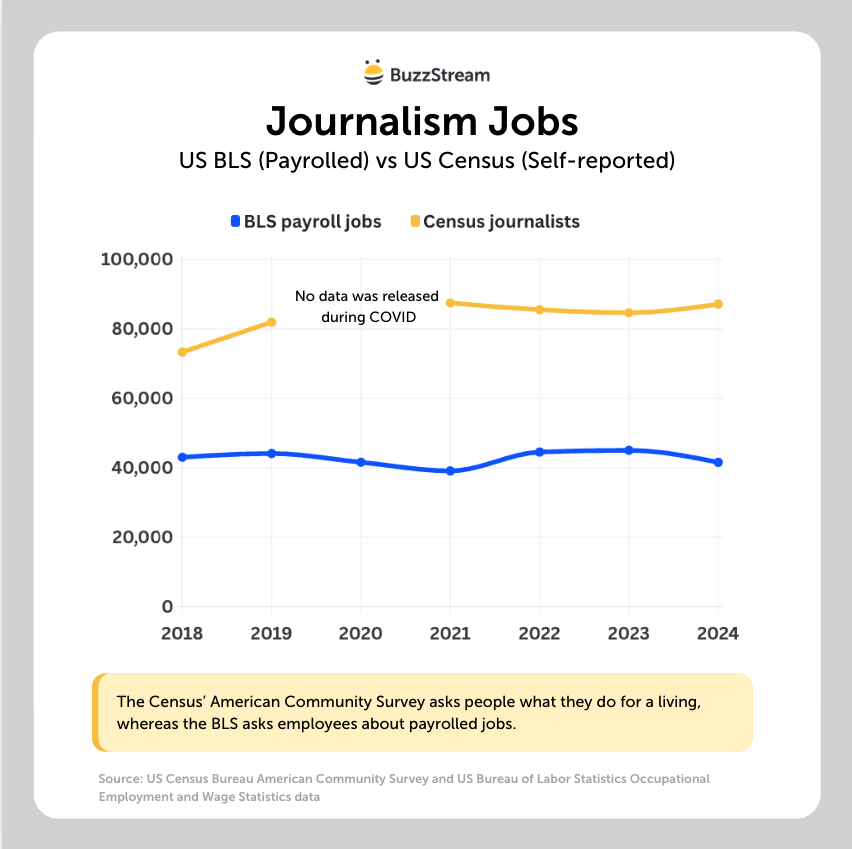
Here it is in table form:
| Year | BLS payroll jobs | Census journalists |
|---|---|---|
| 2018 | 43,030 | 73,329 |
| 2019 | 44,100 | 81,961 |
| 2020 | 41,580 | No data |
| 2021 | 39,080 | 87,515 |
| 2022 | 44,530 | 85,539 |
| 2023 | 45,020 | 84,693 |
| 2024 | 41,550 | 87,160 |
Two federal agencies, counting the same occupation in the same country, have very different numbers.
Why Are These Numbers So Wildly Off?
I mentioned this in the beginning, but if you weren’t paying attention, here’s the most important piece of this: the entire gap comes down to how they count.
BLS asks employers.
If a business doesn’t have you on payroll under that job code, you don’t exist in the data. So freelancers are invisible to BLS data.
The Census asks households what their members’ jobs are. This can include freelancers.
Case closed, right?
What About All of the Layoffs in the News?
Glad you asked!
That was the first thing I thought of when I saw these numbers not declining in recent years.
First off, layoffs aren’t exactly the same thing as net employment.
In one world, a newsroom can cut 50 people and 30 get hired somewhere else, and the national total barely moves.
More importantly though, the Census is two years behind. Their latest release is 2024.
Many of these numbers are pre-AI, which means that we may see a bigger drop-off.
The layoffs for 2026 tracked on sites like the Press Gazette are already trending larger than 2025.
So, by the time the new Census data comes out, I’m guessing we might see these numbers better reflected.
We also haven’t talked about PR professionals’ job growth, which brings us back to that chart in the beginning: how BLS and Census compare PR professional jobs to journalists.
How Many Journalists vs PR Professionals Are There?
BLS counted 283,380 PR specialist jobs in 2025 against 39,250 journalism jobs, a 7.2-to-1 ratio.
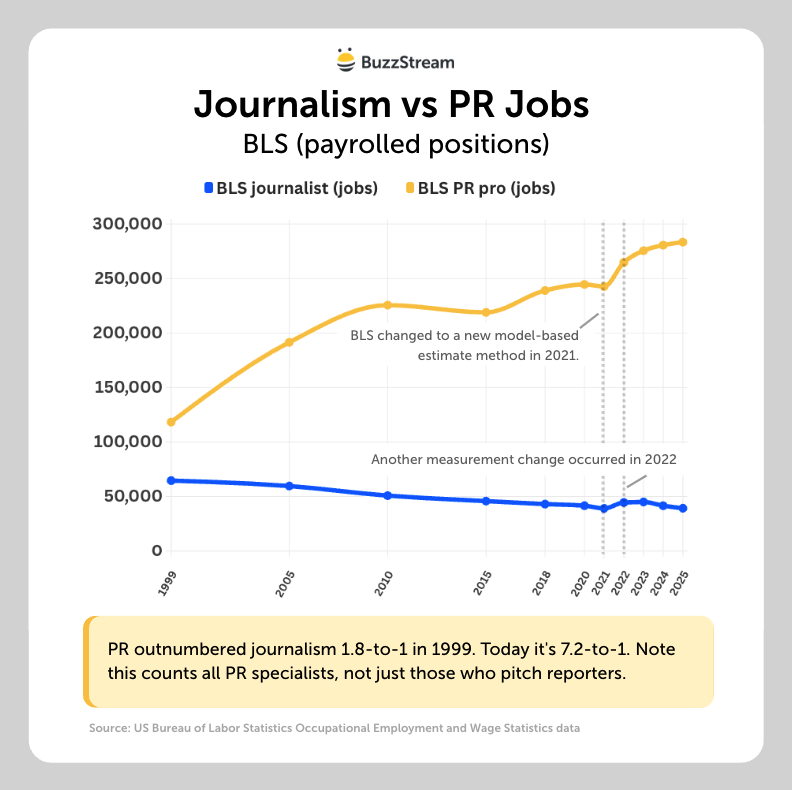
Same caveat as the journalism numbers above: BLS changed its estimation method in 2021 and its industry classification system in 2022.
PR jobs come from the same OEWS survey as journalism jobs, so the same two-era split applies here too, even though the PR occupation code itself never changed.
Here it is in table format:
| Era | Year | BLS journalism jobs | BLS PR jobs | Ratio |
|---|---|---|---|---|
| Old | 1999 | 64,590 | 118,280 | 1.8 to 1 |
| Old | 2005 | 59,600 | 191,430 | 3.2 to 1 |
| Old | 2010 | 50,800 | 225,590 | 4.4 to 1 |
| Old | 2015 | 45,780 | 218,910 | 4.8 to 1 |
| Old | 2018 | 43,030 | 239,030 | 5.6 to 1 |
| Old | 2020 | 41,580 | 244,550 | 5.9 to 1 |
| New | 2021 | 39,080 | 242,710 | 6.2 to 1 |
| New | 2022 | 44,530 | 264,750 | 5.9 to 1 |
| New | 2023 | 45,020 | 275,550 | 6.1 to 1 |
| New | 2024 | 41,550 | 280,590 | 6.8 to 1 |
| New | 2025 | 39,250 | 283,380 | 7.2 to 1 |
Within the old method, PR jobs grew from 118,280 to 244,550 between 1999 and 2020.
Within the new method, PR jobs went from 275,550 in 2023 to 283,380 in 2025.
Under either method, PR employment is dramatically larger relative to journalism than it was in 1999, and it hasn’t reversed.
Takeaway: However you slice the methodology, employers report far more PR jobs than journalism jobs today than they did 25 years ago.
Next, let’s check the Census.
Does the Census Show the Same Ratio of Journalists vs PR Pros?
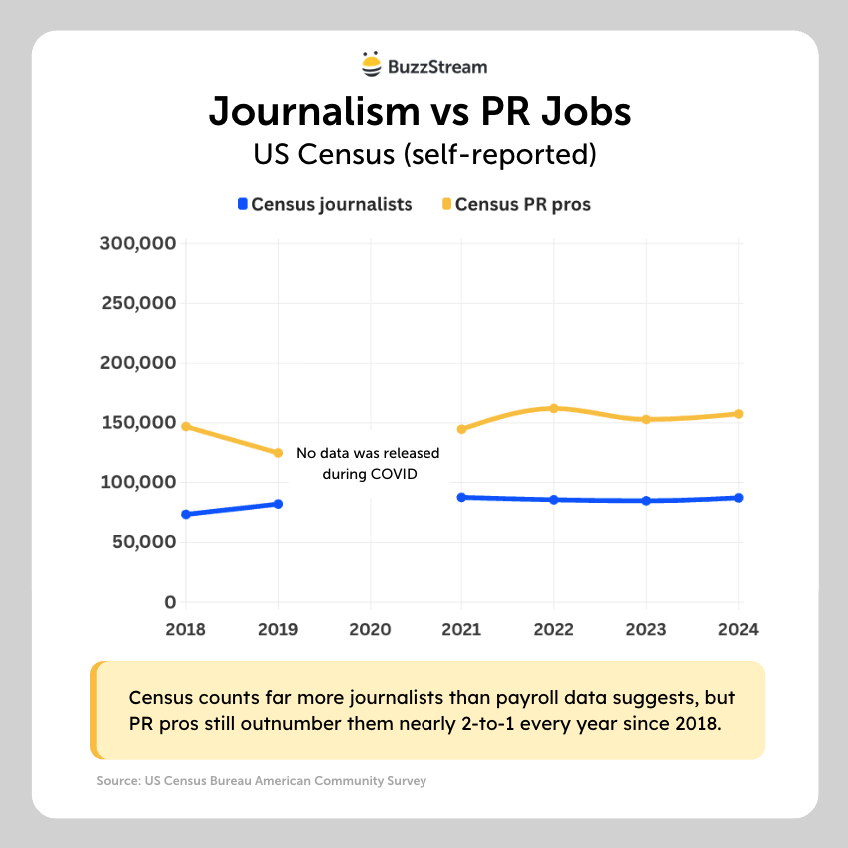
No, the Census puts PR pros at 157,466 and journalists at 87,160 in 2024, a 1.8-to-1 ratio, not 7-to-1.
Here it is in table format:
| Year | Census PR | Census journalists | Ratio |
|---|---|---|---|
| 2018 | 146,880 | 73,329 | 2.0 to 1 |
| 2019 | 124,762 | 81,961 | 1.5 to 1 |
| 2021 | 144,591 | 87,515 | 1.7 to 1 |
| 2022 | 162,038 | 85,539 | 1.9 to 1 |
| 2023 | 152,801 | 84,693 | 1.8 to 1 |
| 2024 | 157,466 (±7,175) | 87,160 (±6,279) | 1.8 to 1 |
The one consistent thing across both datasets is that PR outnumbers journalism in every single year.
So if you’re going to quote a ratio, the honest version is a range, not a number.
Takeaway: : PR professionals outnumber journalists by somewhere between roughly 2 to 1 and 7 to 1, depending on whether you’re counting the narrowest slice of the industry or the broadest one.
So Was That Bloomberg Chart Misleading?
Bringing it full circle, that Bloomberg chart was accurate. Every number in it is real, and Justin Fox didn’t overstate anything:
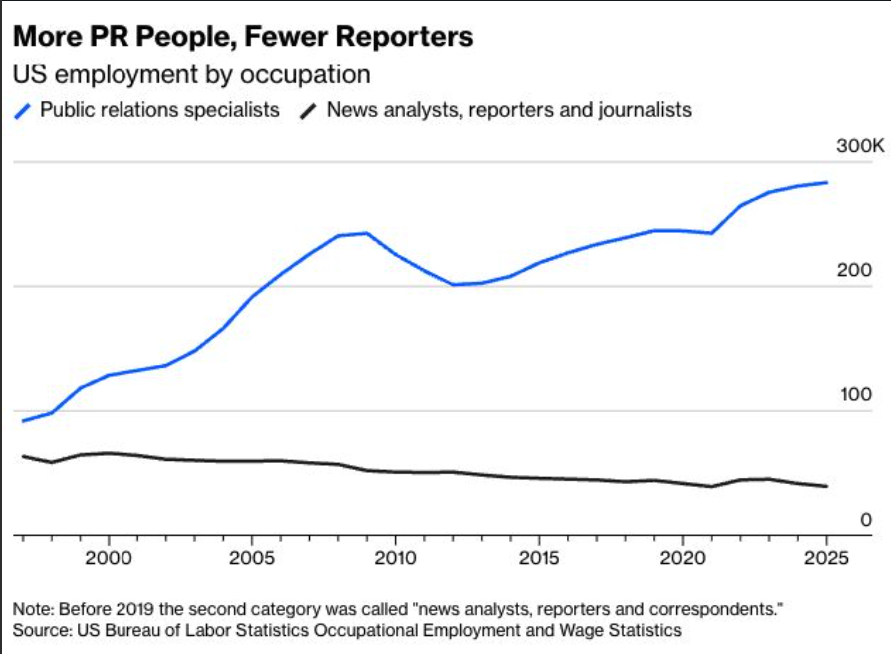
What’s misleading is that the chart shows payroll jobs, and almost everyone sharing it (myself included) viewed it as people.
So 7-to-1 is the payroll number. Counting people, it’s closer to 2-to-1.
What Does This Mean for You in PR?
Honestly? I went into this expecting a clean stat to end on, and I don’t have one.
No clean journalist count or clean ratio.
“So why did I read this, Vince?”, you may be asking.
Stick with me here because I think there is a takeaway:
There are more PR people than journalists.
That’s true in every year, in both datasets, under every methodology, at every ratio between roughly 2 to 1 and 7 to 1.
Nothing I found challenges it.
And that gap widened over 25 years.
Meanwhile, the newsroom side was flat to declining through 2024 and, based on what the layoff trackers are showing, is contracting harder right now than the official data has caught up to.
That’s the finding.
Not a number you can put on a slide, but the direction isn’t ambiguous: more people asking, fewer people to ask.
Good luck out there.
Methodology
I use the BLS Occupational Employment and Wage Statistics (OEWS), 1999–2025, and the Census American Community Survey (ACS), 2018–2024.
BLS’s journalism code changed twice: one combined code through 2003, split into two (27-3021/27-3022) from 2004–2018, merged into the current code (27-3023) from 2019 onward.
I summed the split-era codes to keep the series consistent; otherwise, you’d see artificial jumps at both transitions.
PR (27-3031) never changed codes across the full 26-year window.
BLS switched to model-based estimation (MB3) in 2021 and to the 2022 NAICS industry classification in 2022—two separate changes, one year apart.
BLS itself says OEWS isn’t built for year-over-year comparison, so I’ve treated single-year moves with caution and flagged 2021–2023 specifically as an unsettled transitional window on two fronts.



 Check out the BuzzStream Podcast