
 End-to-end outreach workflow




Table of Contents
- Ranking surveys like “Most,” “best,” and “top” slightly outperformed other formats.
- Positive headlines earned just 11.2 RD per post, while neutral headlines averaged 16.9, and negative headlines averaged 15.6.
- Burnout and financial strain were the strongest emotional hooks.
- Money, entertainment, and food surveys earned more referring domains per post, on average, than most other categories.
- Giving your survey a memorable name may help boost exposure.
Journalists love original data.
Both Muck Rack’s State of Journalism and Cision’s State of the Media reports confirm this.
So last year, I analyzed all the surveys YouGov published to gauge what works.
This year, I looked at another survey platform called Talker Research, which publishes several new survey-based stories a week for brand clients.
We previously interviewed Rick Maughan, Head of Content at Talker Research, on our podcast, where he shared how they ideate such great surveys (check out the full episode).
Now we have the data to back it up.
Before we get started
This study doesn’t cover unlinked mentions and backlinks to the original pieces or brand websites.
I analyzed their survey performance based on backlink data to TalkerResearch.com, which is a key distinction.
So, something can be one of Talker’s strongest-performing earned-media campaigns for a client but still have relatively few referring domains pointing specifically to TalkerResearch.com.
In my conversation with Rick, he told me their ideal goal for clients is to earn exposure and attribution for the brand commissioning the research, rather than TalkerResearch.com pages.
As Rick said:
“Backlinks are only one part of how we measure success for our clients, and often we’d prefer any link to go to the brand we partner with rather than Talker Research. But this gives us a great additional lens on what makes original research resonate and continue to spread well after the results have been released.”
I agree with Rick; since journalists and websites are still linking to these pieces, there’s still a lot to learn from this analysis.
Here’s what we found:
Top 25 Surveys by Unique Referring Domains (RD)
Let’s start with the overall numbers.
Based on pure referring domains, the top survey content they published was one called “ The Perfect Movie Length” which earned 208 RD since April 2024.

(It’s 92 minutes, btw).
This was a survey run by Talker Research for Talker Research; no brand attached.
Second on the list is a survey done for ThriftBooks entitled: “ Survey reveals intentional digital disconnection growing among Americans”, which earned 179 RD since Jan. 2026.
Third is a piece for CubeSmart Self Storage called “ Americans rely on parents’ homes as long-term storage after moving out”, which has gained 132 links since April 1, 2026.
These top three strongly reflect the themes I found in the overall breakdown, especially the focus on emotion.
But more on that later…
Here’s a look at the top 25:
| # | Title | RD | URL |
|---|---|---|---|
| 1 | Research reveals the perfect movie length | 208 | URL |
| 2 | Survey reveals intentional digital disconnection growing among Americans | 179 | URL |
| 3 | Americans rely on parents’ homes as long-term storage after moving out | 132 | URL |
| 4 | Majority of Americans plan to spend tax refund on necessities | 124 | URL |
| 5 | Poll: A quarter of Americans are burnt out before they’re 30 | 115 | URL |
| 6 | Tipflation: Americans spend nearly $500 a year tipping more than they’d like to | 114 | URL |
| 7 | Savings and fitness? Six resolutions top Americans’ 2026 plans | 112 | URL |
| 8 | This state has the best food in the US | 96 | URL |
| 9 | Home is where the party is? Staying in may be the new going out | 93 | URL |
| 10 | Here’s how America does fries | 88 | URL |
| 11 | The Curiosity Compounding Effect | 87 | URL |
| 12 | Poll reveals America’s least-loved holiday movies and top films of 2025 | 84 | URL |
| 13 | Why 2 in 3 are turning to thrifting regularly | 78 | URL |
| 14 | The Sandwich Gap | 77 | URL |
| 15 | The Vacation Compatibility Gap | 76 | URL |
| 16 | The Vacation Value Reset | 73 | URL |
| 17 | Why 70% of Americans are stressed about spending this holiday season | 73 | URL |
| 18 | Media Consumption Trend Report | 73 | URL |
| 19 | Phone at 38%? That’s when most Americans start to panic | 70 | URL |
| 20 | The Long-Distance Tipping Point | 69 | URL |
| 21 | Rising chocolate prices aren’t stopping Gen Z’s Halloween splurge | 69 | URL |
| 22 | Americans buy 745 million pounds of Halloween candy every year | 68 | URL |
| 23 | Why nearly half of your paycheck is spent after the first 48 hours | 67 | URL |
| 24 | The Summer Salvage Effect | 64 | URL |
| 25 | Americans get twice as many scam calls as everyone else | 63 | URL |
Next, let’s get into some top-level takeaways, starting with one that sits between SEO and PR.
Most/Best Posts Use Emotion as a Multiplier
Talker’s ranking studies (i.e., “this state has the best food” or “top New Year’s resolutions”) slightly outperformed their “other” bucket of content from an average RD perspective (16.6 vs 15.3).
| Format | Posts | Total RD | Avg RD/post | Total Links |
|---|---|---|---|---|
| Most/Best/Top/Ranking | 62 | 1,029 | 16.6 | 3,025 |
| Other (stat-reveal style) | 562 | 8,584 | 15.3 | 19,334 |
(This was also a trend from our YouGov analysis.)
These most/best/top/ranking types of posts can generate links passively because they rank for keywords.
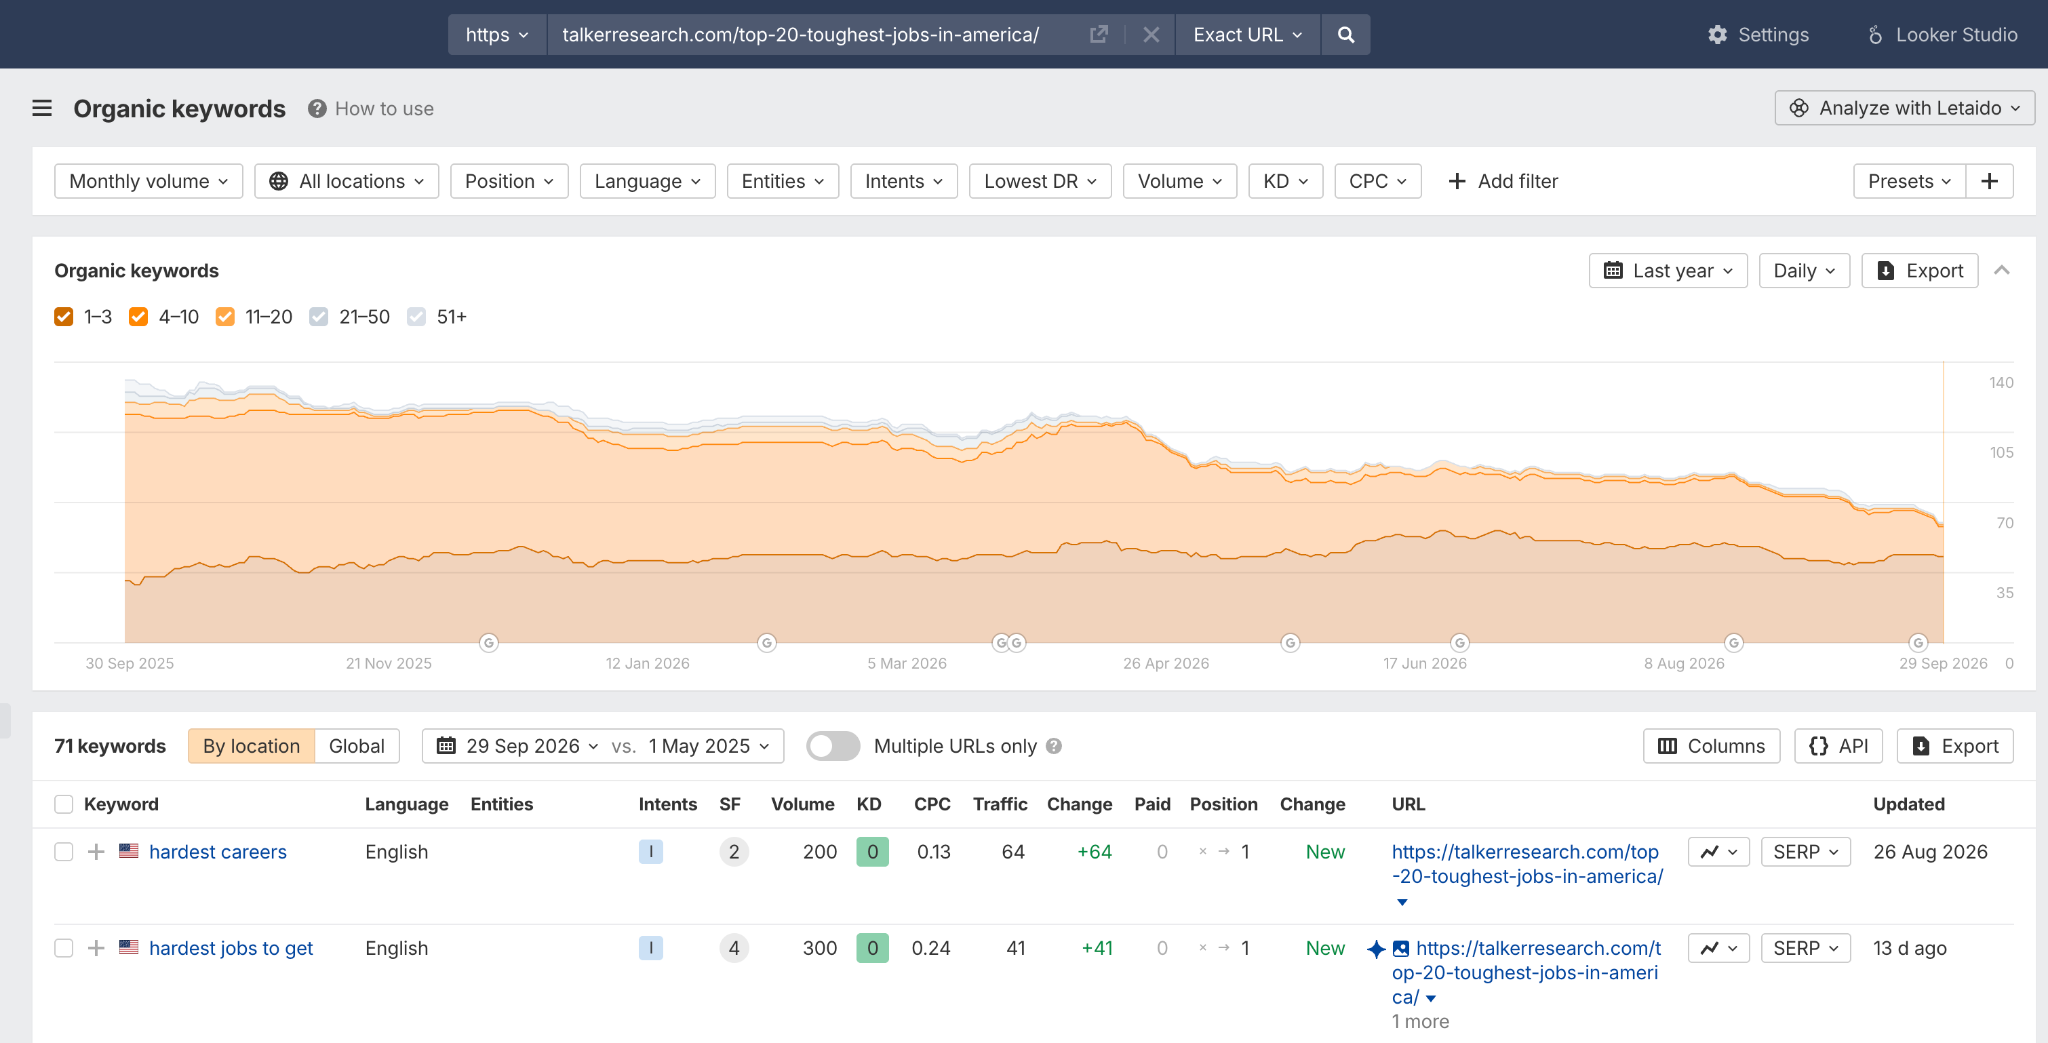
For instance, the survey on the top 20 toughest jobs in America (40 RD), commissioned by Bosch Power Tools, ranks for “hardest careers”.
But these Talker posts have an added layer that makes them even more link-worthy: the emotional component.
Let’s look at these four posts:
| RD | Post | URL |
|---|---|---|
| 112 | Savings and fitness? Six resolutions top Americans’ 2026 plans | URL |
| 96 | This state has the best food in the US | URL |
| 84 | Poll reveals America’s least-loved holiday movies and top films of 2025 | URL |
| 55 | Poll: These are the top 10 countries Americans want to leave the U.S. for | URL |
Each has a clear emotional hook:
- New Year’s resolutions motivate some and stress others.
- Best food is a highly debated topic.
- Holiday movies can spark nostalgia (least-loved can spark humor)
- Leaving the US is a highly charged political topic.
As Rick told me on our podcast, the question they ask when brainstorming is, “Does it generate talk?”
With these most/best-type survey posts, the emotional angle becomes a multiplier, not the entire strategy.
They become assets people not only want to share with colleagues but also have pitchable angles for journalists.
Positive Framing Performs Worst
Neutral and negative titles received more root domains (16.9 neutral and 15.6 negative) on average than positive ones (11.2).
To do this, we used the Valence Aware Dictionary and Sentiment Reasoner (VADER).
So, for you Star Wars fans out there, the dark side seems to win over light (technically, the neutral side dominates).
| Sentiment | Posts | Avg RD | Total Links |
|---|---|---|---|
| Neutral (informational “reveals/finds” framing) | 301 | 16.9 | 11,376 |
| Negative | 204 | 15.6 | 8,918 |
| Positive | 119 | 11.2 | 2,065 |
For better context, a survey like “ Here’s how America does fries”, commissioned by McCain Foods, is neutral.
But we can dig a little more into these themes to really understand what’s happening here.
| Theme | Posts | Avg RD | Total Links |
|---|---|---|---|
| Burnout & Overwork | 29 | 22.6 | 1,929 |
| Financial Strain | 23 | 18.4 | 1,076 |
| Neutral / Informational (baseline) | 301 | 16.9 | 11,376 |
| Fear & Threat | 29 | 14.2 | 611 |
| Loneliness, Decline & Loss | 25 | 13.5 | 1,979 |
| Positive / Excitement-Joy | 119 | 11.2 | 2,065 |
| General Negative (no specific theme) | 60 | 11.8 | 2,342 |
| Controversy, Anger & Judgment | 20 | 11.1 | 471 |
(Note: I’ve omitted any theme with under 20 posts.)
“Burnout & Overwork” was the top, and it’s easy to see why.
Here are some of those top posts:
| RD | Theme | Post | URL |
|---|---|---|---|
| 115 | Burnout & Overwork | Poll: A quarter of Americans are burnt out before they’re 30 | URL |
| 73 | Burnout & Overwork | Why 70% of Americans are stressed about spending this holiday season | URL |
Both cover the topic from different angles; the first from age (burnout under 30).
The second taps into the holiday (stress about spending this holiday season), which is another peg.
Next, let’s look at the industry breakdown.
Money, Entertainment, & Food Got Most Coverage on Average
Based on our categorization, Money & Economy got 25.9 RD per post on average, followed by Food & Drink (25.1 RD), and Entertainment (24.8 RD).
| Category | Posts | Total RD | Avg RD/post |
|---|---|---|---|
| Money & Economy | 60 | 1,475 | 25.9 |
| Entertainment | 21 | 521 | 24.8 |
| Food & Drink | 39 | 928 | 23.8 |
| Technology & AI | 29 | 562 | 19.4 |
| Astrology & Beliefs | 5 | 88 | 17.6 |
| Travel | 51 | 869 | 17.0 |
| Home & Living | 17 | 282 | 16.6 |
| Shopping & Consumer Habits | 9 | 141 | 15.7 |
| Relationships & Dating | 32 | 427 | 13.3 |
| Society & Everyday Life (catch-all) | 170 | 2,120 | 12.5 |
| Work & Career | 26 | 320 | 12.3 |
| Family & Parenting | 76 | 896 | 11.8 |
| Health & Wellness | 39 | 399 | 10.2 |
| Pets & Animals | 24 | 239 | 10.0 |
| Automotive | 11 | 94 | 8.6 |
| Sports | 12 | 85 | 7.1 |
Note: Technically, Beauty & Personal Care generated the most links on average (27.3), but they had only three posts, so I’m putting them as a footnote.
I was surprised to see Money & Economy as the first list, given our State of Digital PR Report found finance the most difficult industry to gain links in.
But let’s see if there’s anything to learn there.
Here are some of the top performers:
| Post | URL | RD |
|---|---|---|
| Majority of Americans plan to spend tax refund on necessities | URL | 124 |
| Tipflation: Americans spend nearly $500 a year tipping more than they’d like to | URL | 114 |
| Why nearly half of your paycheck is spent after the first 48 hours | URL | 67 |
For me, what immediately stands out is how they tie to money.
Rarely are they straightforward headlines like “how much do Americans spend each year?”
Instead, they dig into frustration: why is your paycheck spent right away?
And again, timeliness: How will they spend their tax refund?
They also do a good job of bringing in supportive categories to broaden the pitch potential.
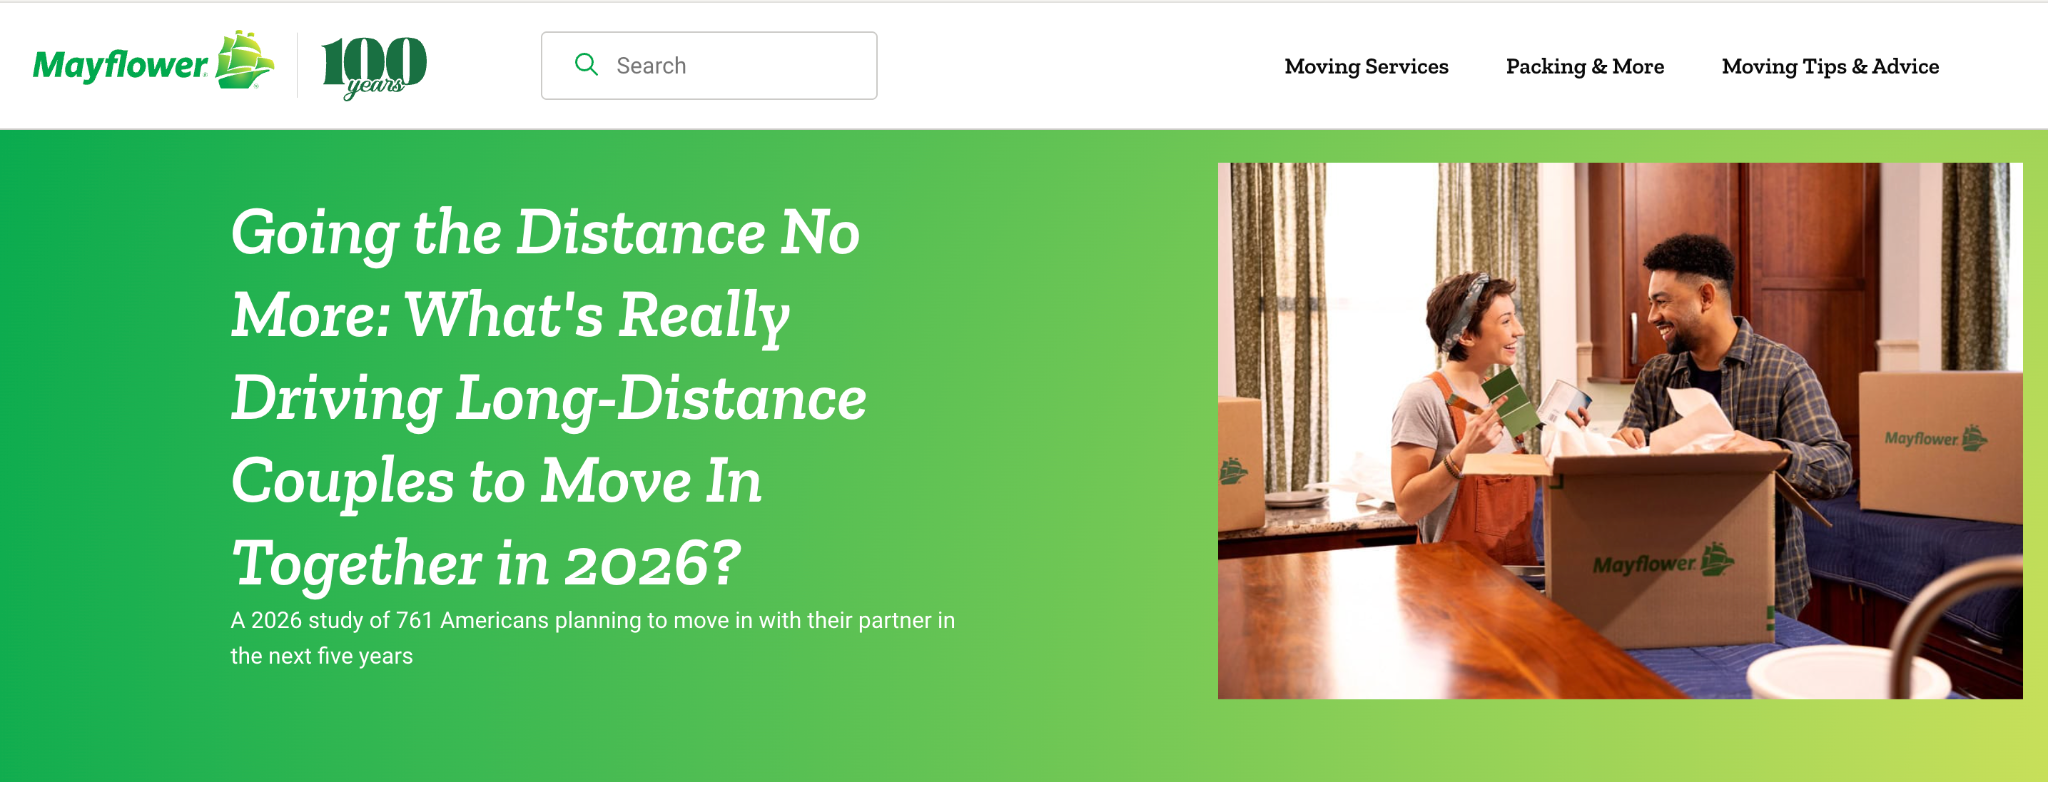
Both “ Long Distance Tipping Point” commissioned by moving company Mayflower:
Last is one strategy I really liked:
Naming or Branding Your Survey to Boost Links
Eight of the more recent posts from March to August 2026 from Talker Research name or brand their surveys, like the “Curiosity Compounding Effect” or “The Sandwich Gap”.
And this framework, though it’s only eight pieces, earned links 11.3x faster per month than a standard survey headline.
Here’s the full list:
| RD | Post | URL |
|---|---|---|
| 87 | The Curiosity Compounding Effect | URL |
| 77 | The Sandwich Gap | URL |
| 76 | The Vacation Compatibility Gap | URL |
| 73 | The Vacation Value Reset | URL |
| 69 | The Long-Distance Tipping Point | URL |
| 64 | The Summer Salvage Effect | URL |
| 61 | The AI Direction Deficit | URL |
| 40 | The Idle Threat | URL |
Again, it’s only a small group of posts (even Rick from Talker told me they are in the early days of testing this strategy).
But I think this tactic goes beyond Talker.
This is one of my favorite strategies, and I’ve seen big brands use it in trend reports with great success.
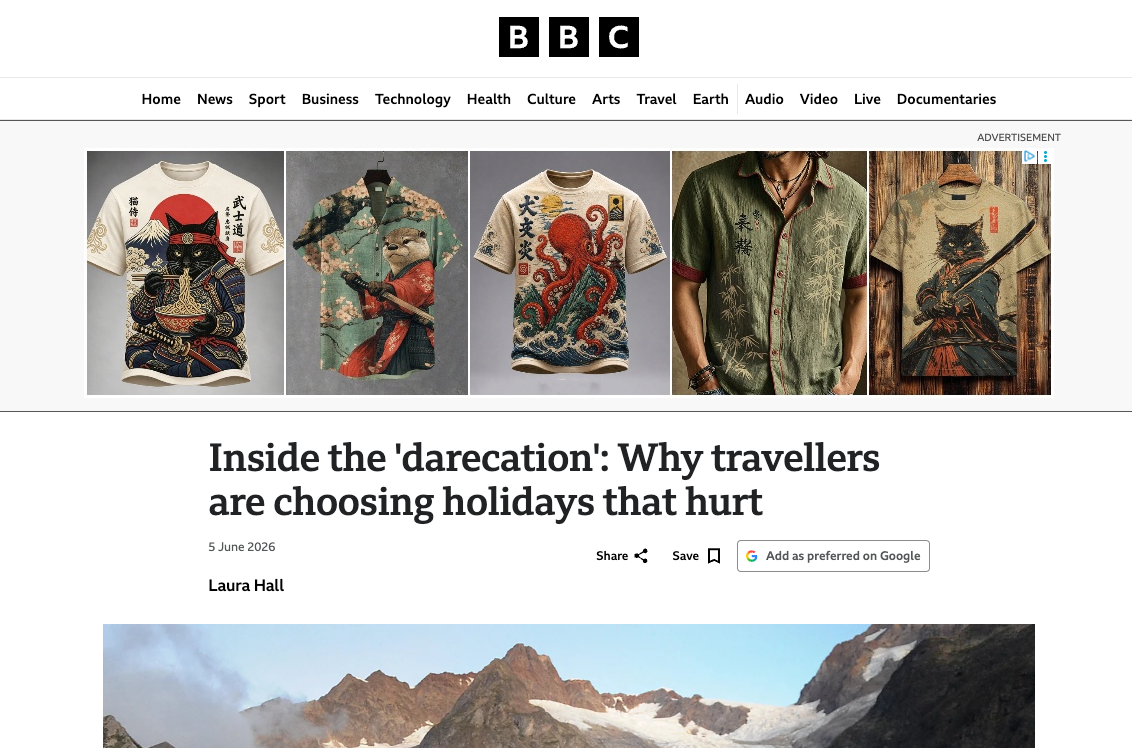
For instance, Pinterest coined the term “ Darecations” in a trends report when talking about thrill-seeking tourist trips.
This kind of hook is something that journalists can sink their teeth into to make a story feel more concrete.
For instance, here’s that “darecation” line in a BBC headline.
This strategy won’t work with every single content type, but it’s certainly worth testing.
What’s the Takeaway for PRs?
So what do you do with all this?
First off, just so you know we are on the right path here, I asked Rick what he thought of the analysis, and he told me, “It’s great to see this analysis identify patterns across hundreds of studies that we’ve often felt instinctively from working on earned media every day.”
Great for me, but what can you, the reader, do with it?
If I were commissioning a survey tomorrow, I wouldn’t start with “what data can we get?”
I’d start by asking how you can tap a tension people feel right now: a strain, a worry, an ongoing debate.
Rick told me, “Good research is about much more than just generating statistics, and this seems to show that, using these metrics, a lot of the highest-performing pieces have a very accessible human story at the core.
Finding the right talking points, tensions, or relevant angles and really thinking from an audience’s perspective is ever more important.”
Get those right, and the data almost writes its own headline.
Methodology
We pulled the full backlink profile for TalkerResearch.com from Ahrefs Site Explorer and stripped out everything that wasn’t a published survey story.
This includes homepage and methodology pages, author and category archives, client case studies, service pages, raw questionnaire PDFs, and duplicate URLs.
Where one story appeared under several URLs (http/https, www variants, trailing slashes, tracking parameters), we merged them into a single canonical post and summed the link metrics, so a big story wouldn’t look artificially split into smaller ones.
That left 624 unique survey posts carrying 9,613 referring domains, spanning early 2022 through August 2026.
We tagged each post three ways, all from the headline: category (17 topic buckets), format (ranking/”most-best” vs. straight stat-reveal), and sentiment, scored with VADER (Valence Aware Dictionary and Sentiment Reasoner) as positive, neutral, or negative.
Contact me for the full dataset.


 Check out the BuzzStream Podcast